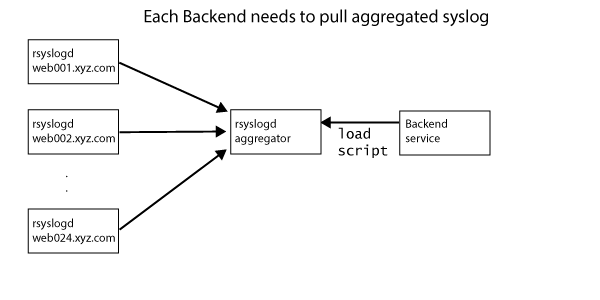
rsyslogd is a tried and true piece of middleware to collect and aggregate syslogs.
Once aggregated into the central server (which is also running rsyslogd), the syslog data is periodically bulk loaded into various data backends like databases, search indexers and object storage systems.

The above architecture can be improved in a few ways:
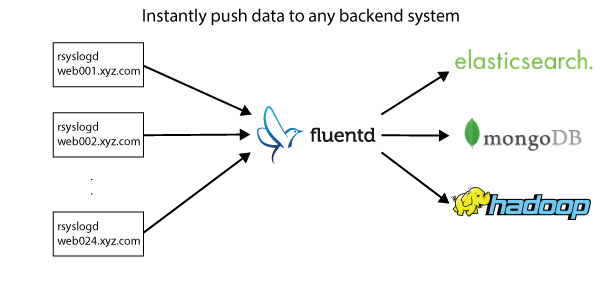
By replacing the central rsyslogd aggregator with Fluentd addresses both 1. and 2.

The rest of the article shows how to set up Fluentd as the central syslog aggregator to stream the aggregated logs into Elasticsearch.
In this guide, we assume we are running td-agent on Ubuntu Precise.
If remote rsyslogd instances are already collecting data into the aggregator rsyslogd,
the settings for rsyslog should remain unchanged. However, if this is a brandnew setup,
start forward syslog output by adding the following line to /etc/rsyslogd.conf
*.* @182.39.20.2:42185
You should replace "182.39.20.2" with the IP address of your aggregator server. Also, there is nothing special about port 42185 (do make sure this port is open though).
On your aggregator server, set up Fluentd. See here for the details.
$ curl -L http://toolbelt.treasuredata.com/sh/install-ubuntu-precise.sh | sh
Next, the Elasticsearch output plugin needs to be installed. Run
/usr/sbin/td-agent-gem install fluent-plugin-elasticsearch
If you are using vanilla Fluentd, run
fluent-gem install fluent-plugin-elasticsearch
You might need to sudo to install the plugin.
Finally, configure /etc/td-agent/td-agent.conf as follows.
<source>
  @type syslog
  port 42185
  tag  rsyslog
</source>

<match rsyslog.**>
  @type copy
  <store>
    # for debug (see /var/log/td-agent.log)
    @type stdout
  </store>
  <store>
    @type elasticsearch
    logstash_format true
    flush_interval 10s # for testing.
    host YOUR_ES_HOST
    port YOUR_ES_PORT
  </store>
</match>
Restart td-agent with sudo service td-agent restart. Then, run tail against /var/log/td-agent.log. You should see the following lines:
2014-06-01 19:41:28 +0000 rsyslog.kern.info: {"host":"precise64","ident":"kernel","message":"[49851.032200] docker0: port 2(veth6091) entering disabled state"}
Then, query Elasticsearch to make sure the data is in there. For example, one can aggregate and filter data based on hostname.
In production, you might want to remove writing output into stdout. So, use the following output configuration:
<match rsyslog.*>
  @type elasticsearch
  logstash_format true
  host YOUR_ES_HOST
  port YOUR_ES_PORT
</match>
Do you wish to store rsyslogd logs into other systems? Check out other data outputs!.
Interested in other data sources and output destinations? Check out the following resources:
Want to learn the basics of Fluentd? Check out these pages.
Couldn't find enough information? Let's ask the community!
You need commercial-grade support from Fluentd committers and experts?
©2010-2026 Fluentd Project. ALL Rights Reserved.
Fluentd is a hosted project under the Cloud Native Computing Foundation (CNCF). All components are available under the Apache 2 License.
The Linux Foundation has registered trademarks and uses trademarks. For a list of trademarks of The Linux Foundation, please see our Trademark Usage page.